Operational analysis for the application of agricultural pesticides is important for choosing the most appropriate equipment, allowing rapid application and cost rationalization
17.05.2023 | 16:58 (UTC -3)
Operational analysis for the application of agricultural pesticides is important for choosing the most appropriate equipment, allowing rapid application and cost rationalization, without compromising the efficiency of phytosanitary control.
Spraying efficiency depends on the land structure and the time lost in maneuvers, refueling, calibration and cleaning, among others. It is an extremely important factor that directly affects operational field capacity.
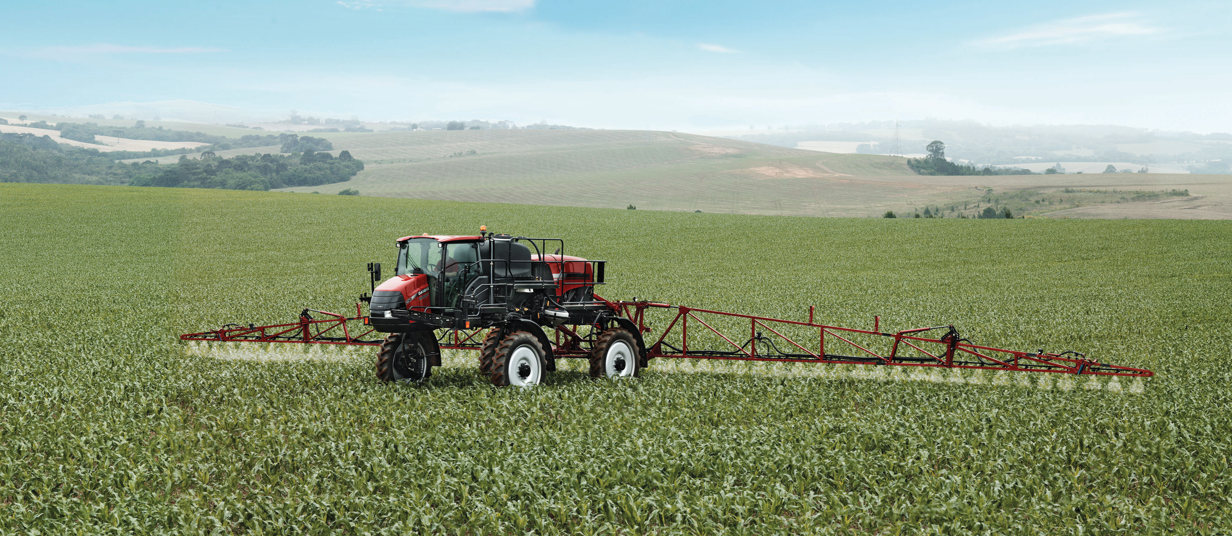
To evaluate the operational performance of a self-propelled sprayer, a study on performance and operational field capacity was carried out in the municipality of Sinop/MT, on the Aeroporto farm. The application of pesticides was carried out on the cotton crop, which was in full vegetative development, with an application volume of 60 L/ha. Data collection was carried out for two plots of the farm. The first called plot 29, with a treated area of 189,9 ha and plot 38 with a treated area of 128,9 ha.
The application was carried out with a John Deere model 4730 self-propelled sprayer. Two timers were used to mark the sprayer travel times, applying to the field, maneuvering and refilling. A Garmin GPS receiver device, Vista model, was placed in the machine's cabin to mark routes with a time interval of 10 s, where its location, speed and other information were stored. The sprayer was regulated and cleaning was also carried out at the end of the previous day, to avoid wasting the working day.
The agricultural pesticide used was Difenoconazole (Score), a systemic fungicide from the triazole chemical group. The water used for syrup was from a reservoir with a capacity of 10 thousand L. With the aid of an electric pump with a flow rate of 470 L/min, the sprayer reservoir was filled and the filling time was recorded on the spreadsheet.
The spraying work began on plot 29, which is close to the headquarters area with an average distance of 200 m. When applying plot 29, four refills of the syrup reservoir were carried out at a location close to the headquarters.
Shortly after application in plot 29, the sprayer moved to plot 38 and the reservoir was refilled in a second “carrier” location next to the cultivated area. At this point was the water tanker trailer, pulled by a Massey Ferguson model 275 tractor, where a pump with a flow rate of 330 L/min was coupled to its TDP, to propel the liquid through the hoses to the sprayer reservoir.
The sprayer was refilled three times for application in plot 38, at the end of the operation in the area, the work was completed.
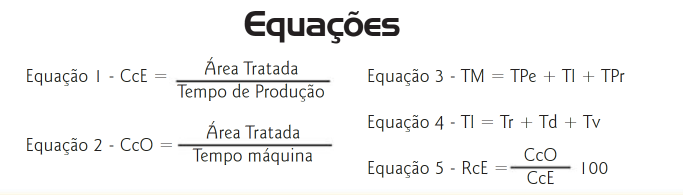
With the data collected in the field, equations were used as a parameter for the analyzed operational performance. The data analyzed were the effective field capacity (CcE) and operational field capacity (CcO) to arrive at the effective field yield (RcE), as can be seen in the box with the equations.
The data collected in the field was downloaded and worked through an electronic spreadsheet where the effective and operational capacity of each plot, field efficiency, as well as spraying logistics were calculated.
The data was downloaded from the Garmin Vista GPS receiver device using the GPS TrackMaker software, where information such as the length of each sample, speed at each point, geographic location, and activity times were acquired.
The entire area of interest for the work was detailed and represented for the study with the data worked on in TrackMaker. It was possible, through a tool in the software, to visualize the area on Google Earth. This process helped in the interpretation of information and served as a parameter for analysis.
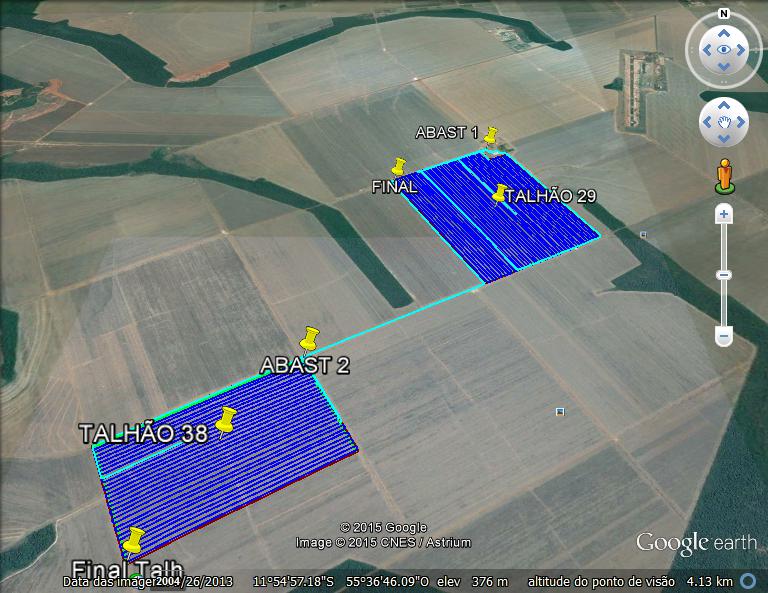
In Figure 1, the points where the sprayer was applied to the plots are identified in dark blue. In lighter color is the movement of the machine when it was not applying, whether going to or returning from the refueling location, or unproductive movement. Important points in the area were also marked, such as the final work point and the supply point.
Figure 1 - Spraying activity map
The values obtained for machine times and operational capacity were collected during the farm's working day, in which the temperature, relative humidity and wind were in ideal conditions for spraying.
Interruption Time (TI)
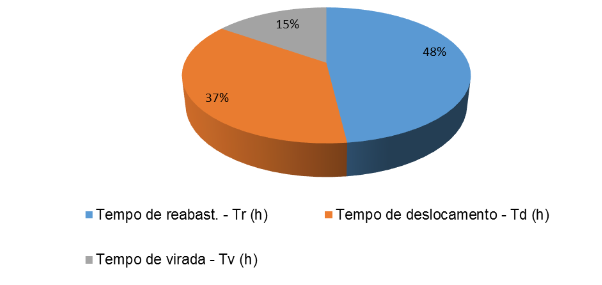
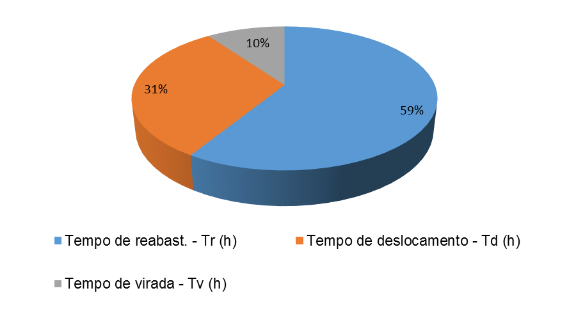
During the time when the machine had its application interrupted by some work factor, each type of interruption in the fields is represented below (Figures 2 and 3).
Figure 2 – Interruption time divisions in plot 29.
Figure 3 – Interruption time divisions in plot 38.
The sprayer travel time, which is the unproductive time of the machine going to refuel and returning to the application area, was greater in plot 29 and added 37% to the interruption time (Figure 2), showing that the sprayer traveled a greater distance for resupply, compared to plot 38.
The time spent refilling the sprayer mixing tank added the most to the total interruption time in both plots, with the highest value in plot 38, at 59% (Figure 3).
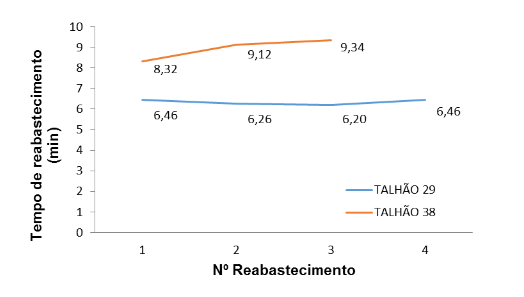
We can observe that in plot 29 where four refills occurred, the time to fill the reservoir was shorter, because it was carried out with the aid of a higher flow electric pump, and in plot 38 where three refills occurred the times were longer (Figure 4), as they were carried out with a pump with a lower flow rate.
Figure 4 – Sprayer reservoir refill times
If it were possible to have the flow rate from the first refueling location (470 L/min) to the second plot of the crop, the total refueling time would decrease from 0,45 h to 0,32 h, resulting in less interruption time and improving operational capacity.
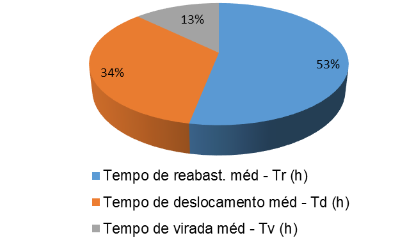
For a general representation of the study, the average was taken across the two plots for interruption times (Figure 5).
The refill time corresponded to the highest percentage of interruption times at 53%, which could be improved by increasing the flow rate of the syrup reservoir filling pump. The turning or maneuvering time corresponded to the shortest interruption time, justified by the areas being flat and regular in shape.
Figure 5 – Average Interruption Time.
TIME MACHINE (TM)
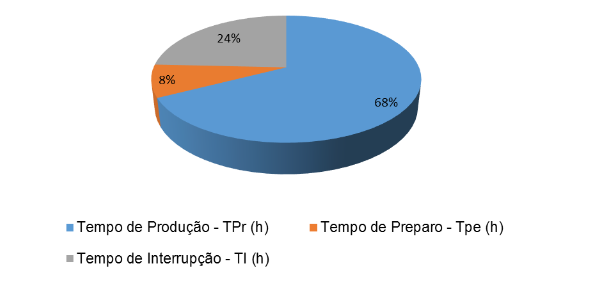
Figures 6 and 7 demonstrate the composition of machine time, production time in the two plots was what contributed most to machine time, and in plot 29 (Figure 6) it represents the highest percentage of participation, 68% of the total time 3,62 h or machine time.
Figure 6 – Machine time in plot 29.
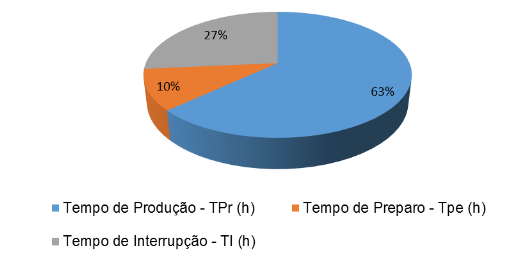
The machine time in plot 38 (Figure 7) showed that the interruption time in this plot contributed with a higher percentage, with the interference of the factors mentioned previously, such as the supply time, which was also responsible for this increase.
Figure 7 – Machine time in plot 38.
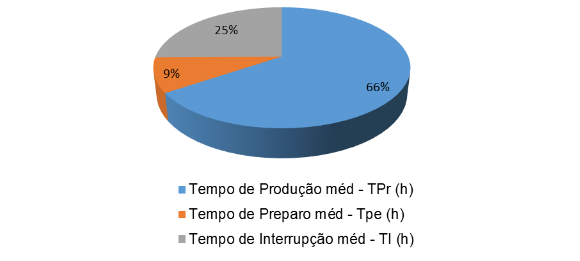
In Figures 8 and 9 we observe that the preparation time (Tpe) was very similar for both plots, as it only represented the time it took to fill the fuel tank at the beginning of the day.
Figure 8 – Average machine time.
SIMULATION
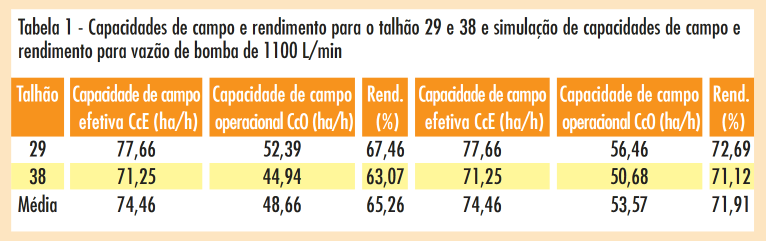
With the data obtained in the field, the effective and operational field capacity of each plot was calculated, as well as their yield for the two operational field capacity calculation methods and an average was made between plots 29 and 38 with the pump flows. of 470 and 330 L/min and simulated with data from plots 29 and 38 with a refueling pump with a flow rate of 1100 L/min (Table 1).
On the national market there are pump options for refilling the sprayer reservoir with a flow capacity of up to 1100 L/min. The higher flow reduces sprayer interruption time, directly impacting operational field capacity and yield. Rural producers are often concerned about increasing the size of the spray bar, reducing the volume of spray solution and increasing the speed, but forget about the details of the reservoir refill pump.
With the simulation of the increase in the refueling pump flow, the average operational capacity increased by 4,91 ha/h and obtained a 10% increase in the average effective operational yield.
CONCLUSIONS
The time spent refilling the sprayer reservoir, followed by the travel time for refilling, represented a high influence on the application interruption time, being the most impactful.
The flow rate of the sprayer reservoir refill pump was what most influenced operational capacity, making it advisable to opt for high-flow pumps.
BOX 1
Equations used to calculate effective field yield
Effective field capacity (CcE) is the capacity actually demonstrated by the machine. Production time is the time in which the machine was actually used in the operation. To calculate the effective field capacity (ha/h) equation 1 was used.
Operational field capacity (CcO) is the capacity of the machine observed in real operating conditions, where all the effects of operational factors are taken into account.
The operational field capacity (ha/h) was calculated according to equation 2.
Machine time (TM) (equation 3) consists of preparation time, interruption time and production time. In this equation, TPe (preparation time) is the time consumed in preparing the machine to go into operation and to leave it in a condition to be stored in the warehouse after operation. TI (interruption time) is that spent on interruptions resulting from the machine's own work when operating in the field, TPr (production time) is that actually consumed in the work for which the machine was designed.
Interruption time (TI) (equation 4) is represented by refueling time, travel time and turning time. In this case, Tr (refill time) refers to the time used to refill the sprayer reservoir, Td (travel time) is represented by the time in which the machine moves, going to or from the supply point. point to the point of resuming the interrupted work and Tv (turning time) represents the time spent turning at the head of each application range.
The operational field capacity represents a fraction of the effective capacity, therefore, it is always smaller, as it takes into account all interruptions during operation. This relationship was calculated through the effective field yield (%) and is in equation 5.